-
If you are citizen of an European Union member nation, you may not use this service unless you are at least 16 years old.
-
You already know Dokkio is an AI-powered assistant to organize & manage your digital files & messages. Very soon, Dokkio will support Outlook as well as One Drive. Check it out today!
| |
Distance Learning Optional Resources for Pre-Algebra
Page history
last edited
by Christine Koerner 3 years, 5 months ago
Each District/School has the choice of how to implement distance learning with their students.
The following is a sample of how math remote learning can be implemented at home. This is guidance and should not be interpreted as a state requirement.
General Optional Resources:
No-Tech Optional Resources:
Online Calculators:
Desmos Collections:
Ready for High School Math Course:
Bootstrap Computer Science Integration (for Bootstrap trained teachers)
Instructional Learning Activities and Resource Database:
Showing Activities for Grades 6-8
Optional Activity Sets:
Special thanks to Fawn Nguyen of Rio School District for originally compiling all PK-8 activity sets.
|
Activity Set 1
|
Number Puzzle (Source: https://openupresources.org/math-curriculum/)
Tyler says he invented a number puzzle. He asks Clare to pick a number, and then asks her to do the following:
-
Triple the number
-
Subtract 7
-
Double the result
-
Subtract 22
-
Divide by 6
Clare says she now has a -3. Tyler says her original number must have been a 3. How did Tyler know that? Explain your reasoning.
Perfect Squares (Source: https://www.openmiddle.com/)
Using the digits 1- 9, at most one time each, to fill in the boxes to make each expression evaluate to a perfect square number.
Extension/Challenge: What is the largest/smallest square number you can make? How many different perfect square numbers could be made?

Moldy Math (Source: Critical Thinking Puzzles, Michael A. DiSpezio, 1996)
You look behind the stove and discover a slice of bread that you misplaced several weeks ago. Needless to say, it is covered with mold. Since the mold started growing, the area it has covered has doubled each day. By the end of the 8th day, the entire surface of the bread is covered. When was the bread half-covered with mold?
|
|
Activity Set 2
|
Equations (Source: https://openupresources.org/math-curriculum/)
Solve each of these equations. Explain or show your reasoning.
-
2(x+5) = 3x+1
-
3y-4 = 6-2y
-
3(n+2) = 9(6-n)
Put Them in Order (Source: brilliant.org)
For two vehicles to be next to each other, they have to satisfy these rules:
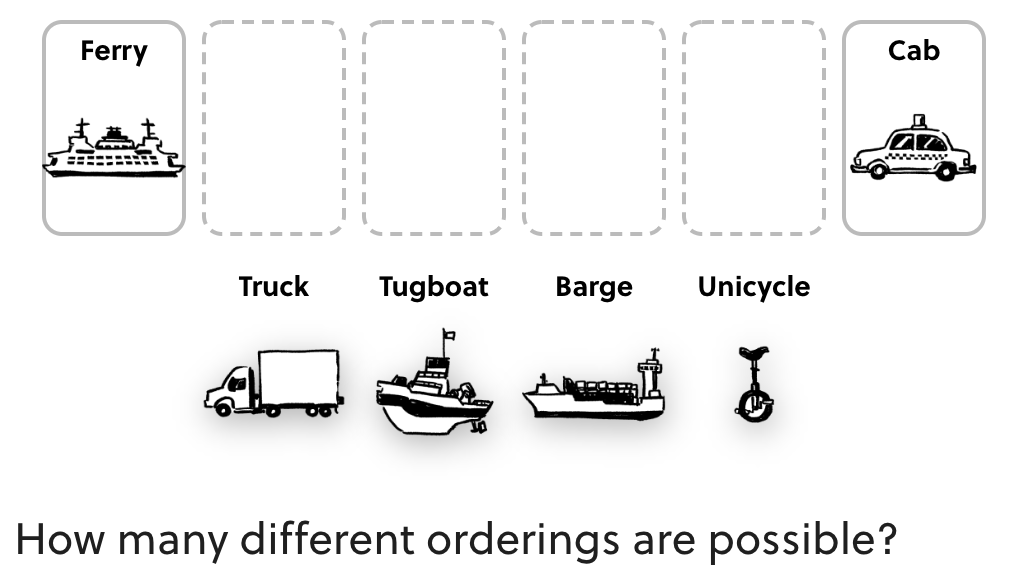
How many different orderings are possible?
Fraction Talk (Source: http://fractiontalks.com/)
What fraction of the square is shaded green? Explain.

|
|
Activity Set 3
|
Pythagorean Theorem (Source: https://www.openmiddle.com/)
What could the lengths of the legs be such that the lengths are integers and x is an irrational number between 5 and 7?

Which One Doesn’t Belong? (Source: wodb.ca)
Choose a graph in this picture that you don’t think belongs with the rest. Explain why. Can you pick another graph and give a different reason?

Equations (Source: https://openupresources.org/math-curriculum/)
Solve each equation, and check your solution.
-
19(2m-16) = 13(2m+4)
-
-4(r+2) = 4(2-2r)
-
12(5+2y) = 4y-(6-9y)
|
|
Activity Set 4
|
Temperature (Source: https://openupresources.org/math-curriculum/)
Here is the graph of a linear equation.

Select all true statements about the line and its equation.
-
One solution of the equation is (3, 2).
-
One solution of the equation is (-1, 1).
-
One solution of the equation is (1, 32).
-
There are 2 solutions.
-
There are infinitely many solutions.
-
The equation of the line is y = 14x + 54.
-
The equation of the line is y = 54x+14.
Weighing Balls (Source: https://plus.maths.org/content/Puzzle)
Suppose you are given eight balls and you know that one ball is slightly heavier than all the others, which are of equal weight. You're also given a balancing scale with which you can compare the weight of balls by putting some in one pan and some in the other. What's the minimum number of weighings you need to establish which ball is the heavier one?
Visual Pattern (Source: visualpatterns.org)
Below is a pattern of cylinders in stages 1-3 below.
-
Draw what you think stage 4 might look like.
-
Draw or describe what you think stage 10 might look like.
-
Label how many cylinders are in each stage.
-
Try to write an equation to describe the relationship between the stage number n and the number of cylinders C.

|
|
Activity Set 5
|
Word Problem (Source: https://openupresources.org/math-curriculum/)
A participant in a 21-mile walkathon walks at a steady rate of 3 miles per hour. He thinks, “The relationship between the number of miles left to walk and the number of hours I already walked can be represented by a line with slope -3.” Do you agree with his claim? Explain your reasoning.
Mobile (Source: https://solveme.edc.org/Mobiles.html)
What is the value of the trapezoid? The triangle?
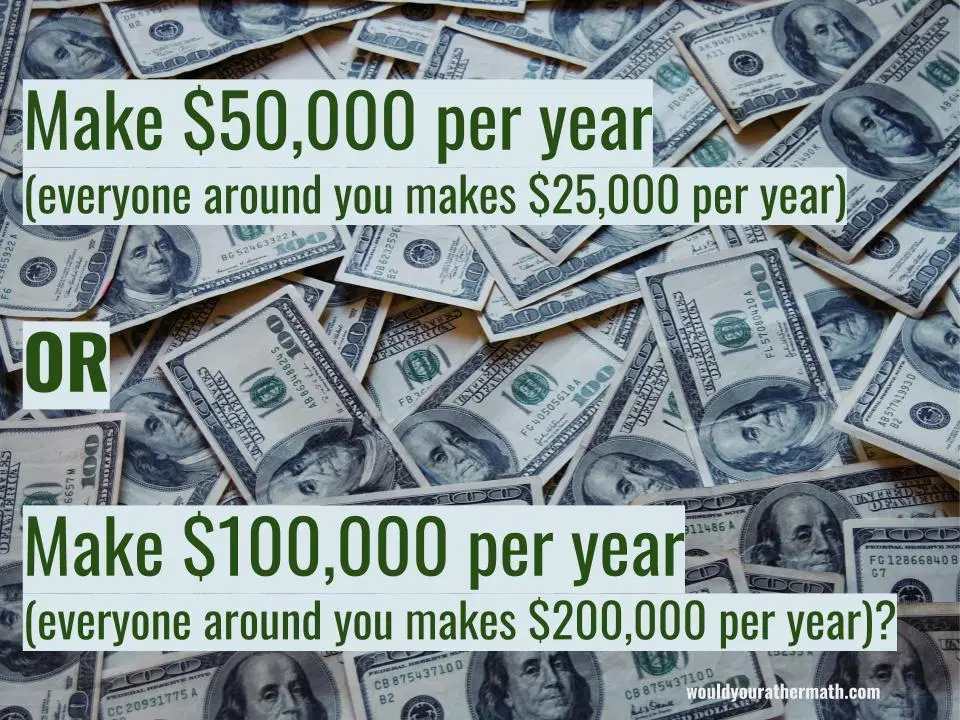
Would You Rather (Source: https://www.wouldyourathermath.com/)
Would you rather have a cube of gold that measures 25 mm on each side, or two cubes of gold, one is 24 mm per side, and one is 7 mm per side?
Whichever option you choose, justify your reasoning with mathematics.

|
|
Activity Set 6
|
Number Puzzle (Source: https://openupresources.org/math-curriculum/)
Jada had some dimes and quarters that had a total value of $12.50. The relationship between the number of dimes, d, and the number of quarters, q, can be expressed by the equation 0.1d+0.25q = 12.5.
-
If Jada has 4 quarters, how many dimes does she have?
-
If Jada has 10 quarters, how many dimes does she have?
-
Is the number of dimes a function of the number of quarters? If yes, write a rule (that starts with d=...) that you can use to determine the output, d, from a given input, q. If no, explain why not.
-
If Jada has 25 dimes, how many quarters does she have?
-
If Jada has 30 dimes, how many quarters does she have?
-
Is the number of quarters a function of the number of dimes? If yes, write a rule (that starts with q=...) that you can use to determine the output, q, from a given input, d. If no, explain why not.
What is the value of the last row?

Connect the Dots (Source: Critical Thinking Puzzles, Michael A. DiSpezio, 1996)
Starting at the top center dot, can you connect all of the other nine dots with only four straight lines? The four lines must all be connected and your pencil can’t leave the paper while drawing the answer.

|
|
Activity Set 7
|
Equations (Source: https://openupresources.org/math-curriculum/)
Brown rice costs $2 per pound, and beans cost $1.60 per pound. Lin has $10 to spend on these items to make a large meal of beans and rice for a potluck dinner. Let b be the number of pounds of beans Lin buys and r be the number of pounds of rice she buys when she spends all her money on this meal.
-
Write an equation relating the two variables.
-
Rearrange the equation so b is the independent variable.
-
Rearrange the equation so r is the independent variable.
Fit the Pieces Together (Source: brilliant.org)
The four puzzle pieces below fit into the 4 x 4 grid without rotation or reflection.
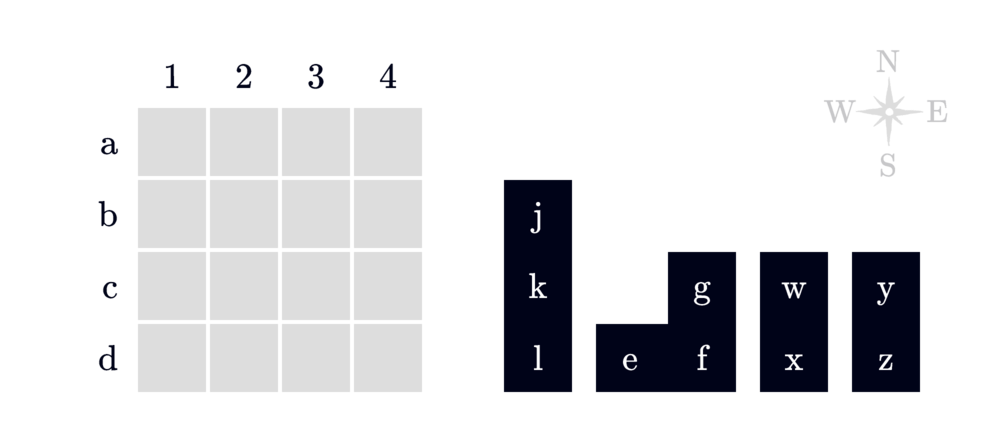
Based on these clues, where is E located?
-
K touches W and G (they can touch diagonally).
-
F touches L and Z (they can touch diagonally).
-
X does not touch K, even diagonally.
-
Y is in a row below K's row.
Fraction Talk (Source: http://fractiontalks.com/)
What fraction of the square is shaded by each color? How do you know?

|
|
Activity Set 8
|
Which One Doesn’t Belong? (Source: wodb.ca)
Choose a graph in this picture that you don’t think belongs with the rest. Explain why. Can you pick another graph and give a different reason?

Magic 19 (Source: https://plus.maths.org/content/Puzzle)
Here are 19 dots arranged in a hexagon. Your task is to label the dots with the numbers 1 to 19 so that each set of three dots that lie along a straight-line segment add up to 22.

Equations (Source: https://openupresources.org/math-curriculum/)
Solve each equation, and check your solution.
-
2x+4(3-2x) = 3(2x+2)6+4
-
4z+5 = -3z-8
-
12-18q = q-14
|
|
Activity Set 9
|
Equal Averages (Source: https://plus.maths.org/content/Puzzle)
There are several different notions of average: the mean, the median, the mode and the range. If you work out each of these for the set of numbers 2, 5, 5, 6, 7, you'll notice something interesting — they are all equal to 5!
Can you find other sets of five positive whole numbers where mean = median = mode = range?
Graphing (Source: https://openupresources.org/math-curriculum/)
-
Graph a system of linear equations with no solutions.
-
Write an equation for each line you graph.

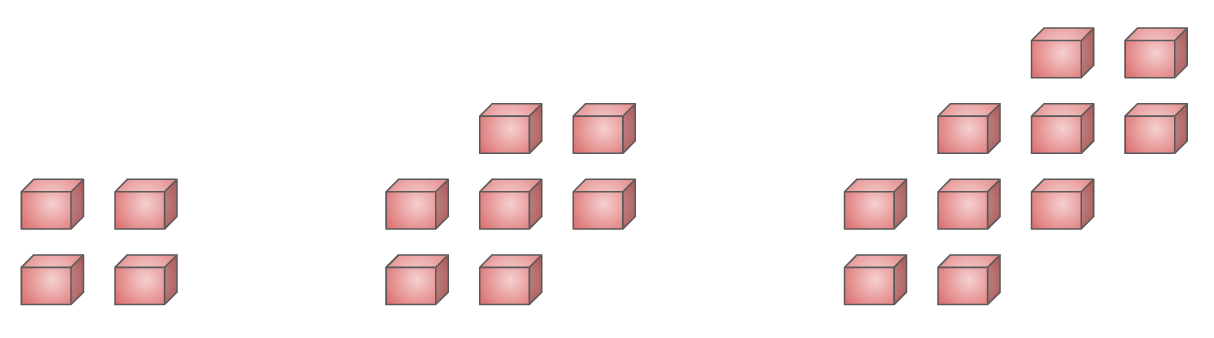
Visual Pattern (Source: visualpatterns.org)
Below is a pattern of cubes in stages 1-3 below.
-
Draw what you think stage 4 might look like.
-
Draw or describe what you think stage 10 might look like.
-
Label how many cubes are in each stage.
-
Try to write an equation to describe the relationship between the stage number n and the number of cubes C.
|
|
Activity Set 10
|
Word Problem (Source: https://openupresources.org/math-curriculum/)
The graphs of three functions are shown.

-
Match each of these equations to one of the graphs.
-
d=60t, where is the distance in miles that you would travel in t hours if you drove at 60 miles per hour.
-
q=50-0.4d, where d is the number of quarters, and is the number of dimes, in a pile of coins worth $12.50.
-
A=r2, where A is the area in square centimeters of a circle with radius r centimeters.
-
Label each of the axes with the independent and dependent variables and the quantities they represent.
-
For each function: What is the output when the input is 1? What does this tell you about the situation? Label the corresponding point on the graph.
-
Find two more input-output pairs. What do they tell you about the situation? Label the corresponding points on the graph.
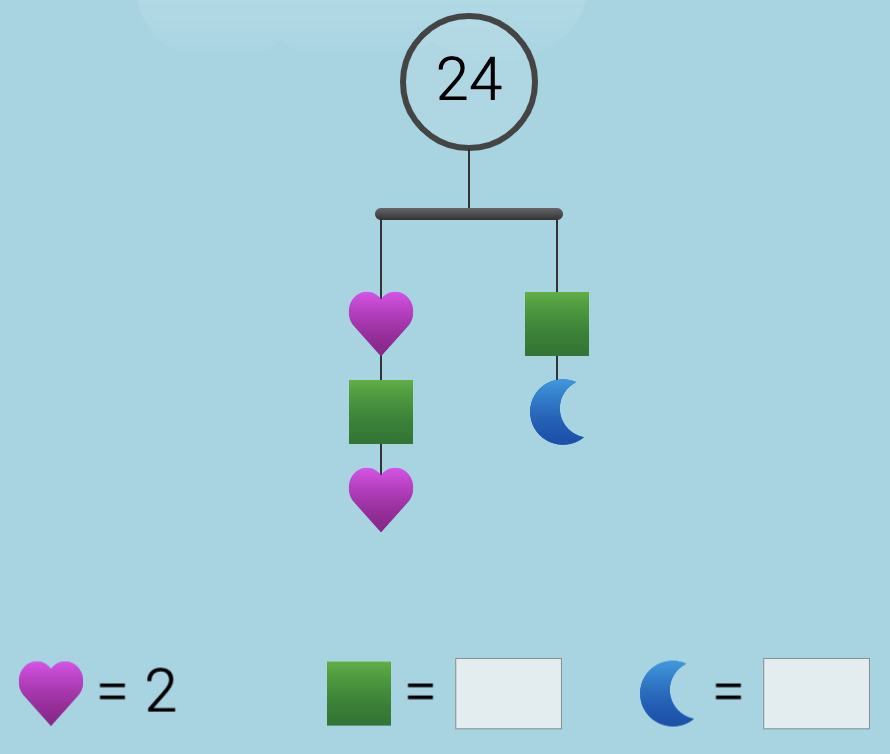
Mobile (Source: https://solveme.edc.org/Mobiles.html)
What is the value of the square? The crescent?
Would You Rather (Source: https://www.wouldyourathermath.com/)
Whichever option you choose, justify your reasoning with mathematics.
|
|
Activity Set 11
|
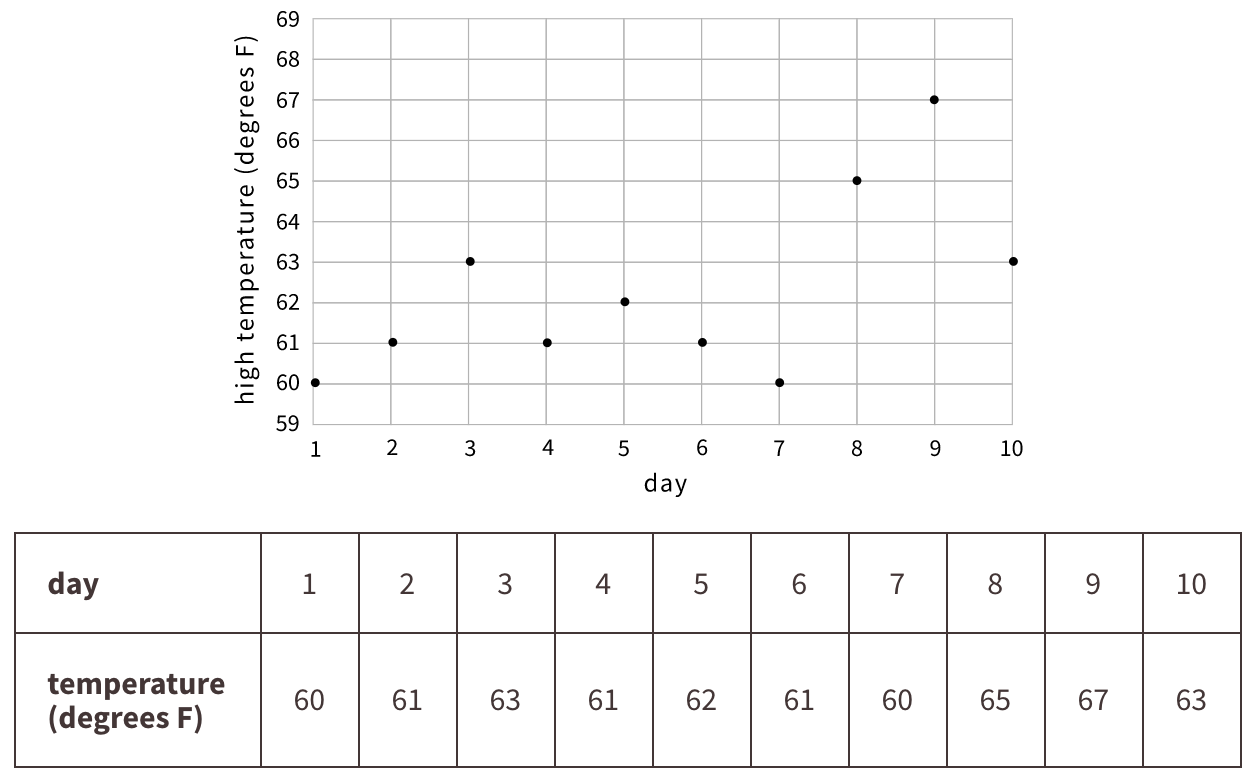
Table and Graph (Source: https://openupresources.org/math-curriculum/)
The graph and the table show the high temperatures in a city over a 10-day period.
-
What was the high temperature on Day 7?
-
On which days was the high temperature 61 degrees?
-
Is the high temperature a function of the day? Explain how you know.
-
Is the day a function of the high temperature? Explain how you know.
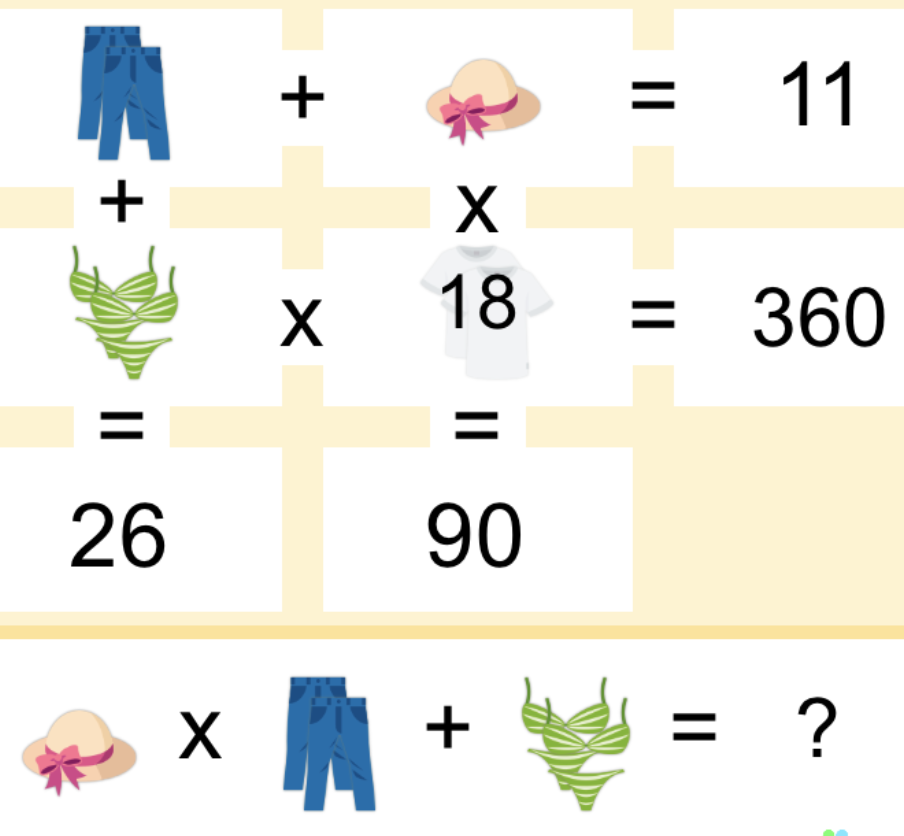
Puzzle (Source: https://www.solvemoji.com/)
What is the value of the last row?
Which One Doesn’t Belong? (Source: wodb.ca)
Choose a number in this picture that you don’t think belongs with the rest. Explain why. Can you pick another number and give a different reason?

|
|
Activity Set 12
|
Story Problem (Source: https://openupresources.org/math-curriculum/)
The amount Lin’s sister earns at her part-time job is proportional to the number of hours she works. She earns $9.60 per hour.
-
Write an equation in the form y=kx to describe this situation, where x represents the hours she works and y represents the dollars she earns.
-
Is y a function of x? Explain how you know.
-
Write an equation describing x as a function of y.
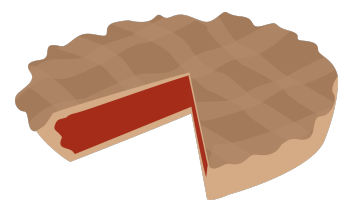
Baking Pies (Source: brilliant.org)
It takes 5 cooks 5 hours to bake 5 pies. Assuming no change of rate, how many hours will it take 10 cooks to bake 10 pies?
Is It Possible? (Source: brilliant.org)
To solve the problem, put in the number tiles so that every row and column adds up to the target sum beside it.

|
|
Activity Set 13
|
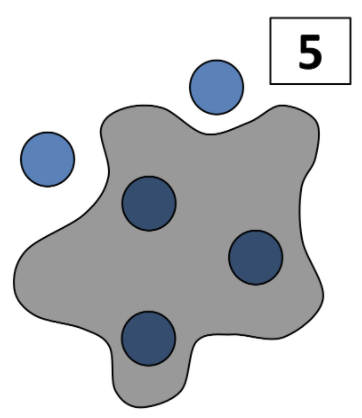
Splat (Source: https://stevewyborney.com/2018/09/splat-for-google-slides-40-lessons/)
To solve a Splat puzzle, you need to figure out what is covered up by the black splat. For example, this puzzle has a total value of 5, but you only see 2 circles, so what is underneath the splat?
|
Puzzle
|
Answer
|
|

|
|
What is covered up by the splat?

Scientific Notation 2 (Source: https://www.openmiddle.com/)
Using the digits 1 to 9, at most one time each, fill in the boxes to make a product that equals 800,000,000.

Fraction Talk (Source: http://fractiontalks.com/)
What fraction of the large triangle is represented by each region? (Do all your fractions add up to one whole?)
|
|
Activity Set 14
|
Graphing (Source: https://openupresources.org/math-curriculum/)
Use the equation 2m+4s = 16 to complete the table, then graph the line using s as the dependent variable.

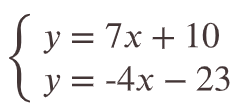
System of Equations (Source: https://openupresources.org/math-curriculum/)
Solve the system of equations:
Visual Pattern (Source: visualpatterns.org)
Below is a pattern of parallelograms in stages 1-3 below.
-
Draw what you think stage 4 might look like.
-
Draw or describe what you think stage 10 might look like.
-
Label how many shaded parallelograms are in each stage.
-
Try to write an equation to describe the relationship between the stage number n and the number of shaded parallelograms P.

|
|
Activity Set 15
|
Interior Angles (Source: https://www.openmiddle.com/)
Using the digits 0 through 9 at most one time, fill in the boxes to make the sum of the interior angles of a triangle.

Mobile (Source: https://solveme.edc.org/Mobiles.html)
What is the value of the square? The rhombus?

Graphing (Source: https://openupresources.org/math-urriculum/)
Here is the graph of a function showing the amount of money remaining on a subway fare card as a function of the number of rides taken.

-
What is the output of the function when the input is 10? On the graph, plot this point and label its coordinates.
-
What is the input to the function when the output is 5? On the graph, plot this point and label its coordinates.
-
What does point P tell you about the situation?
|
|
Activity Set 16
|
Scatter Plot (Source: https://openupresources.org/math-curriculum/)
-
Draw a line that you think is a good fit for this data. For this data, the inputs are the horizontal values, and the outputs are the vertical values.

-
Use your line of fit to estimate what you would expect the output value to be when the input is 10.
Puzzle (Source: https://www.solvemoji.com/)
What is the value of the last row?
Which One Doesn’t Belong? (Source: https://openupresources.org/math-curriculum/)
Choose a graph in this picture that you don’t think belongs with the rest. Explain why. Can you pick another graph and give a different reason?

|
|
Activity Set 17
|
Story Problem (Source: https://openupresources.org/math-curriculum/)
A recipe for bread calls for 1 teaspoon of yeast for every 2 cups of flour.
-
Name two quantities in this situation that are in a functional relationship.
-
Write an equation that represents the function.
-
Draw the graph of the function. Label at least two points with input-output pairs.
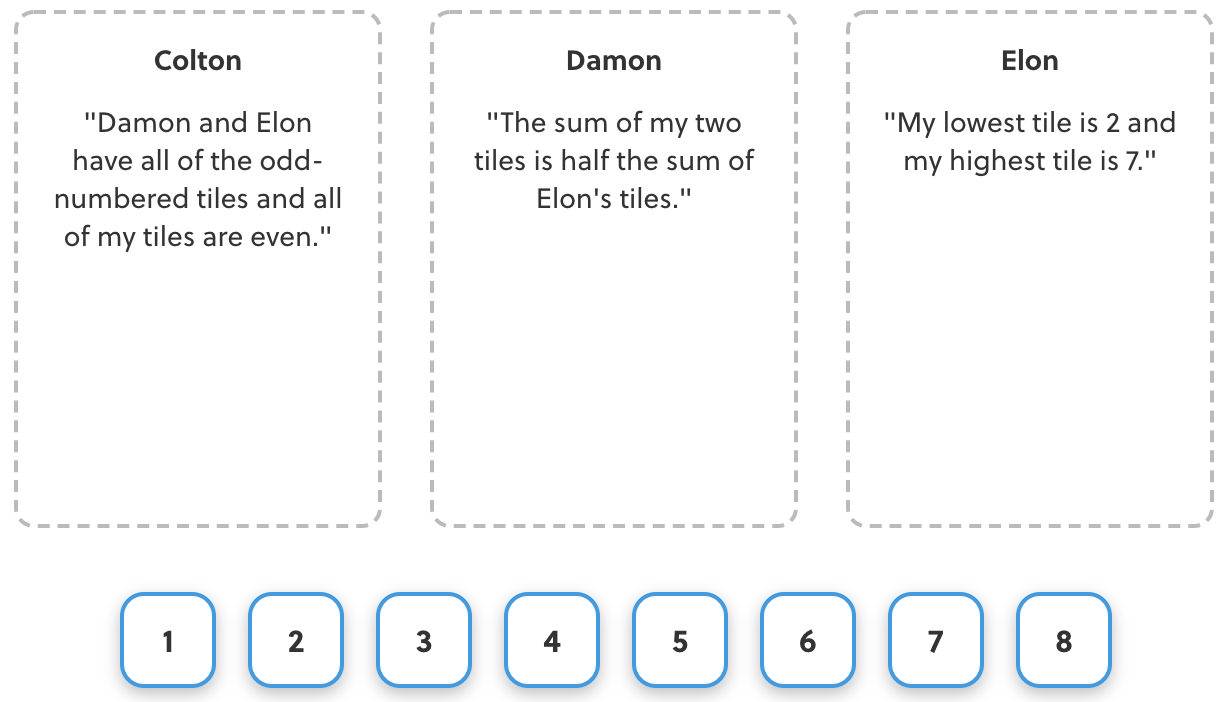
Puzzle (Source: brilliant.org)
If you arrange all eight of the tiles below to make all of the claims true, what is Damon's highest-numbered tile?
Is It Possible? (Source: brilliant.org)
To solve the problem, put in the number tiles so that every row and column adds up to the target sum beside it.

|
|
Activity Set 18
|
Pythagorean Theorem
Using the digits 0 to 9, at most one time each, fill in the boxes to find two pairs of possible lengths for the missing sides.

Splat (Source: https://stevewyborney.com/2018/09/splat-for-google-slides-40-lessons/)
To solve a Splat puzzle, you need to figure out what is covered up by the black splat. For example, this puzzle has a total value of 5, but you only see 2 circles, so what is underneath the splat?
|
Puzzle
|
Answer
|
|
|
|
What is covered up by the splat?

Scatter Plot (Source: https://www.openmiddle.com/)
Which of these statements is true about the data in the scatter plot?

-
As x increases, y tends to increase.
-
As x increases, y tends to decrease.
-
As x increases, y tends to stay unchanged.
-
x and y are unrelated.
|
|
Activity Set 19
|
Exponents (Source: https://openupresources.org/math-curriculum/)
Write each expression with a single exponent:

System of Equations (Source: https://openupresources.org/math-curriculum/)
Solve the system of equations:

Visual Pattern (Source: visualpatterns.org)
Below is a pattern of squares in stages 1-3 below.
-
Draw what you think stage 4 might look like.
-
Draw or describe what you think stage 10 might look like.
-
Label how many squares are in each stage.
-
Try to write an equation to describe the relationship between the stage number n and the number of squares S.

|
|
Activity Set 20
|
Rational and Irrational Roots (Source: https://www.openmiddle.com/)
Using digits 0 to 9, at most one time each, fill in the boxes to create the following number types.

Puzzle (Source: brilliant.org)
Hana, Ivan, and Jackson have divided up a set of tiles numbered 1 through 9. Who has the tile numbered 5?

Graphing (Source: https://openupresources.org/math-urriculum/)
Elena and Jada distribute flyers for different advertising companies. Elena gets paid 65 cents for every 10 flyers she distributes, and Jada gets paid 75 cents for every 12 flyers she distributes.
Draw graphs on the coordinate plane representing the total amount each of them earned, y, after distributing x flyers. Use the graph to decide who got paid more after distributing 14 flyers.

|
Distance Learning Optional Resources for Pre-Algebra
|
|
Tip: To turn text into a link, highlight the text, then click on a page or file from the list above.
|
|
|
|
|


Comments (0)
You don't have permission to comment on this page.